
Twitter bots powered by Wikipedia: An interview with Darius Kazemi, internet artist
We wanted to learn more.

Plotting a course through charted waters: A website workshop on data visualization literacy
Mikhail Popov, a data scientist at the Wikimedia Foundation, recently led a workshop on how to interpret different types of statistical graphics and how to glean insights from them. The workshop is now available on a website for everyone to learn from.
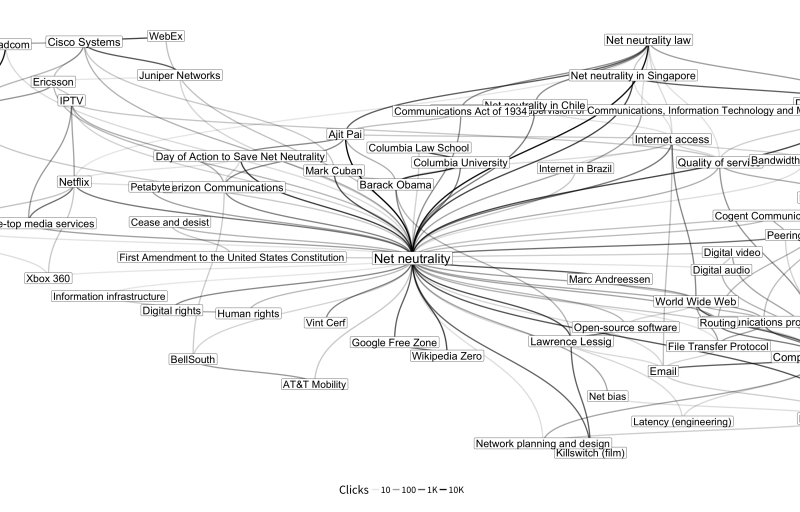
How we made that net neutrality clickstream diagram
To illustrate our recent post on Wikipedia clickstream 'rabbit holes,' the Wikimedia Foundation's Mikhail Popov used R code to create a net neutrality clickstream. An overview of core graph theory terms is provided, along with brief introductions to R packages igraph, ggplot2, and ggraph. While some familiarity with R is necessary, he includes a list of free resources for learning it at the bottom.
.png)

New monthly dataset shows where people fall into Wikipedia rabbit holes
The Wikimedia Foundation’s Analytics team is releasing a monthly clickstream dataset. The dataset represents—in aggregate—how readers reach a Wikipedia article and navigate to the next. Previously published as a static release, this dataset is now available as a series of monthly data dumps for English, Russian, German, Spanish, and Japanese Wikipedias.

Hiring a data scientist
We recently needed to backfill a data analyst position at the Wikimedia Foundation. If you’ve hired for this type of position in the past, you know that this is no easy task. Based on our successful hiring process, we’d like to share what we learned, and how we drew on existing resources to synthesize a better approach to interviewing and hiring a new member of our team.