Fundraising reports: Difference between revisions
Content deleted Content added
m Fundraising graphs moved to Fundraising report: This will be a more descriptively-accurate name for the page. |
m red line = first day |
||
| Line 1: | Line 1: | ||
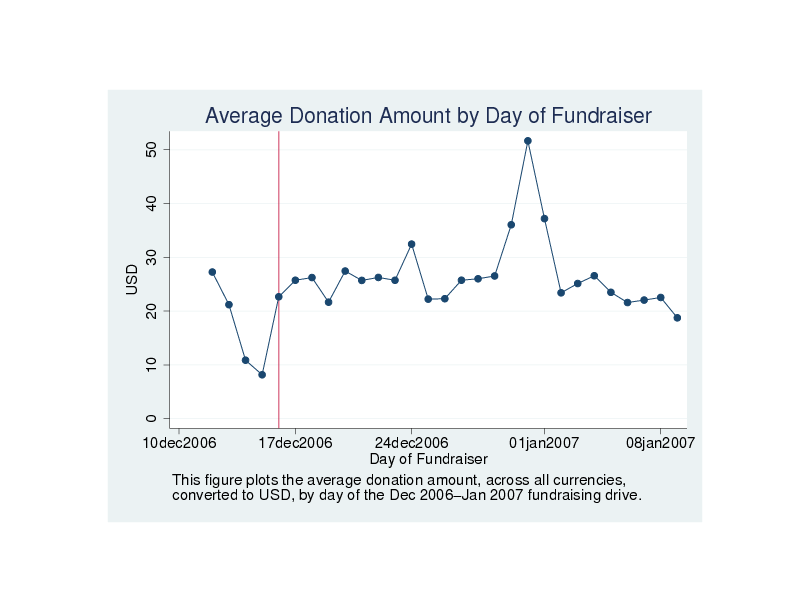
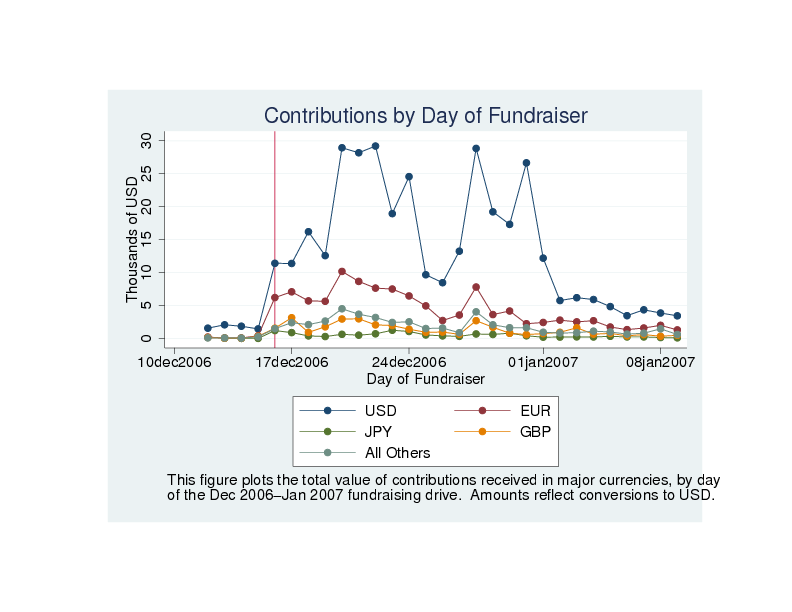
The Wikimedia Foundation's fundraiser from 16Dec2006-15Jan2007 succeeded in raising just more than USD$1 million. The first three graphs on this page show the day-by-day progress of the fundraiser in terms of total donations, across all currencies, up through 10Jan2007. First, average donation size is shown; second, the number of donations; and third, the total USD value of all donations. The second set of three graphs show analogous information, disaggregated by currency. |
The Wikimedia Foundation's fundraiser from 16Dec2006-15Jan2007 succeeded in raising just more than USD$1 million. The first three graphs on this page show the day-by-day progress of the fundraiser in terms of total donations, across all currencies, up through 10Jan2007. First, average donation size is shown; second, the number of donations; and third, the total USD value of all donations. The second set of three graphs show analogous information, disaggregated by currency. The vertical red line in each figure marks the first day of the fundraiser. |
||
[[Image:Totavgamtperday2006.png|left|Average donation size by day]] [[Image:Totcountperday2006.png|left|Number of donations by day]] |
[[Image:Totavgamtperday2006.png|left|Average donation size by day]] [[Image:Totcountperday2006.png|left|Number of donations by day]] |
||
Revision as of 16:55, 18 January 2007
The Wikimedia Foundation's fundraiser from 16Dec2006-15Jan2007 succeeded in raising just more than USD$1 million. The first three graphs on this page show the day-by-day progress of the fundraiser in terms of total donations, across all currencies, up through 10Jan2007. First, average donation size is shown; second, the number of donations; and third, the total USD value of all donations. The second set of three graphs show analogous information, disaggregated by currency. The vertical red line in each figure marks the first day of the fundraiser.


